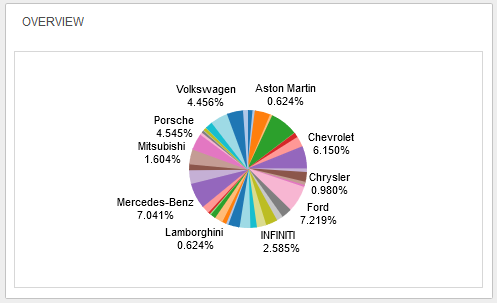
The STEP Web UI supports integration with data analytics tools like Tableau and Qlik. Through configuration of the Web UI, admin users can add both a homepage widget (shown below) and a Web UI screen designed specifically to display visually compelling views of data (called dashboards) from data analytics tools.
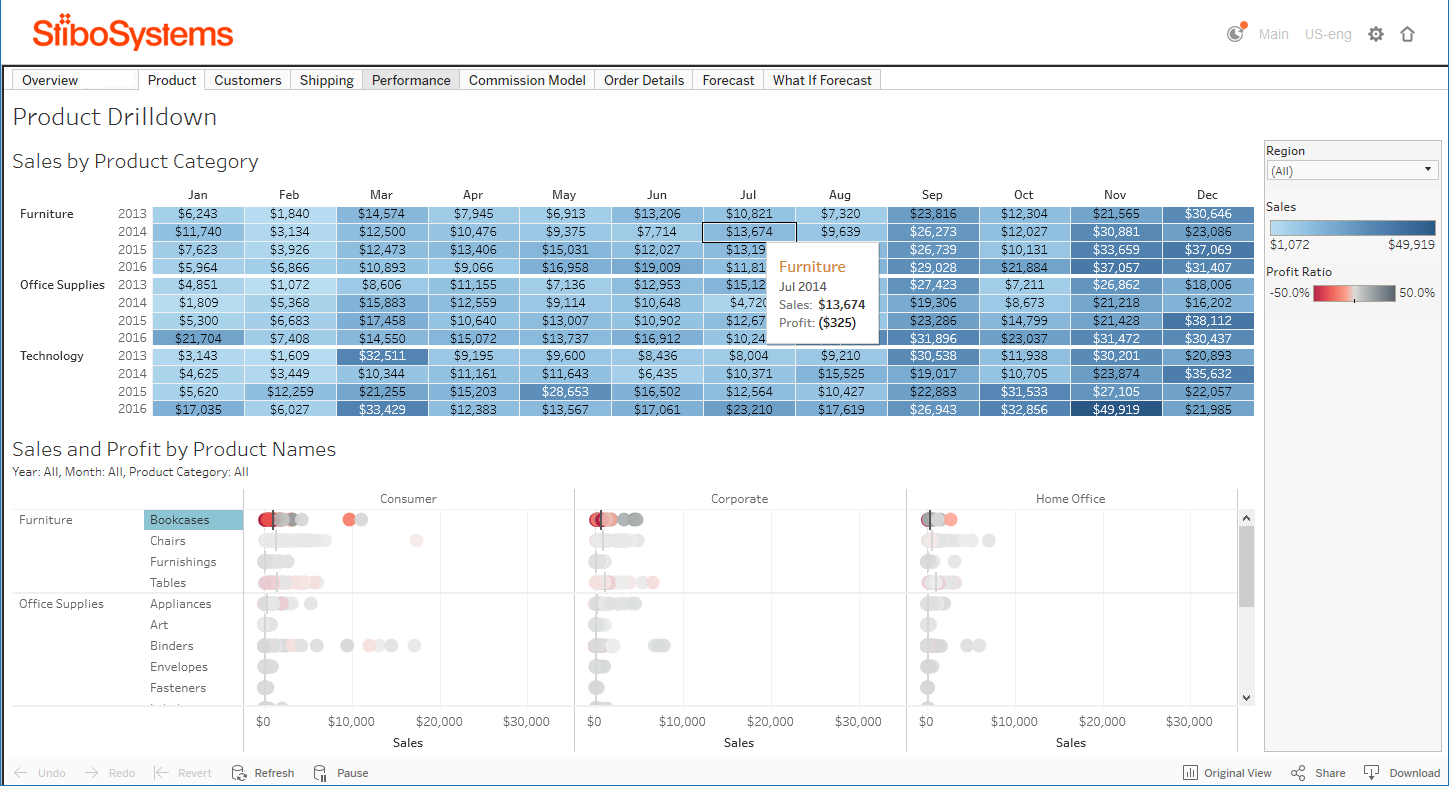
The Analytics Homepage Widget (shown above) is useful as a quick, simplified view of a dashboard, while the Analytics Screen (shown below) offers a more expansive view of analytics data, allowing for more interaction.
Users have the ability to utilize analytics tools in a variety of ways. They may:
Complementary to this Web UI capability, the Java Database Connectivity (JDBC) delivery plugin feature can be configured to automatically (or manually) make STEP data available to the analytics platform. This feature effectively closes the loop of data and visualization by making STEP data viewable in a data analytics dashboard, which is in turn viewable in the Web UI. For information regarding proper setup of JDBC in conjunction with data analytics integration with the Web UI, see the Analytics Using JDBC Example topic, also in the Data Formats guide here.
Information related to configuration of data analytics tools in the Web UI can be found in the Analytics Configuration topic in this documentation here.
2019, Stibo Systems – Confidential