The STEP platform supports integration with data analytics tools like Tableau Server and Qlik Server in the STEP Web UI. Data analytics dashboards can be displayed in the Web UI in either a homepage widget or in a screen. STEP also supports automatic authentication for Tableau and Qlik, which allows users seamless access to dashboards in the Web UI. A successful integration that includes automatic authentication may require configuration steps be taken in the Web UI, the data analytics tool, and the application server. This guide describes only those actions that can be taken in the STEP Web UI and the application server. Configuration actions that must be taken in the relevant data analytics tools are detailed in the appropriate vendor documentation.
This functionality supports the sharing of attribute values with the analytics environment, thus creating a dynamic dashboard that is filtered based on the selected STEP node.
Important: Implementation of a data analytics integration with the STEP Web UI does require a specific license to enable the required components.
The Analytics Screen is a Web UI screen that can display a much larger analytics dashboard. The screen is typically added as a tabbed page to any mapped object where the specific data analytics dashboard is most pertinent.
Both the homepage widget and the screen are configured in almost identical ways. The configuration steps described below can be applied to configuring either the widget or the screen, except where expressly noted.
The analytics screen must be added before it can be configured as described below. The method for adding screens in the Web UI is detailed in the Creating a New Screen section of the Design Mode Basics topic
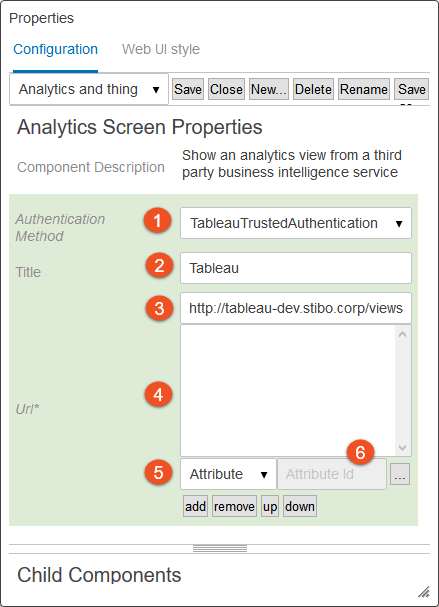
Using the analytics screen, admin users are able to create a view from the Web UI into a published data analytics dashboard. Below is a screenshot of the Properties window for the analytics screen in the Web UI designer. The parameters that appear in the screenshot are described in detail directly beneath the screenshot.
 ) beside it. Once clicked the user may then select the appropriate attribute value in the node picker window. If a user selects 'Today', then the sixth field will display allowing users to add the date in the proper format.
 After the attributes needed to implement a dynamic dashboard view have been added, but before the URL has been manually edited to include the placeholders, the URL might look something like this:
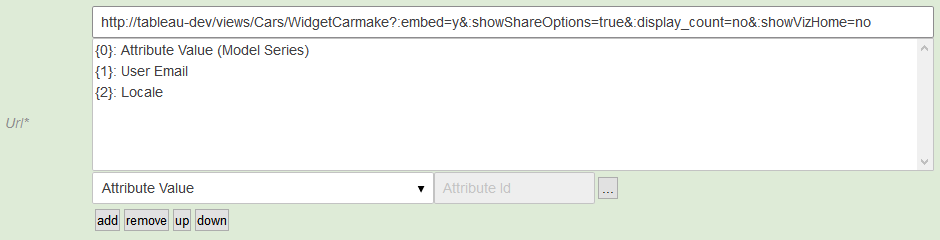
As shown in the screenshot above, the selected attributes are listed along with a braced number (ex. '{0}'). These braced numbers act as placeholders that can be manually added into the URL. Adding these braced numbers into the URL actuates a dynamic view of the dashboard.
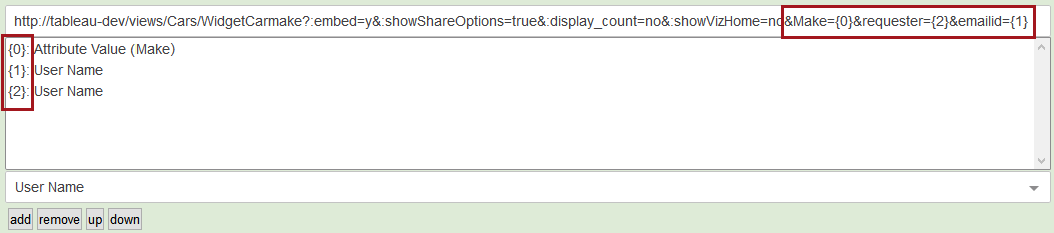
In the example below, the Tableau field 'Make' is mapped to placeholder {0}, Tableau field 'requester' is mapped to placeholder {2}, and Tableau field 'emailed' is mapped to placeholder {1}.
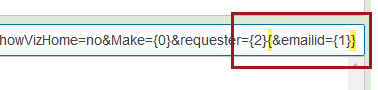
Braces can be encapsulated within braces to ensure that a URL is always valid (e.g. to avoid 404 errors), especially if one of the placeholders does not return any content. If such a placeholder within the encapsulated section does not return content, the entire section within braces will be removed from the URL parameter. An example of this is shown in the screenshot below.
For more information on how to structure the URL, users should reference the 'Using Field and Filter Values in URLs' topic in the documentation available for the relevant analytics tool.
The Analytics Homepage Widget provides users with a quick and simple view of an analytics dashboard on the Web UI's homepage. The appearance and behavior of the analytics widget is, in large part, determined by how the dashboard is configured in the analytics tool itself. These dashboards can vary greatly based on the specific business need. Analytics homepage widgets can be single- or double-width, and multiple homepage widgets can be configured to display multiple views of analytics dashboards.
The Analytics Homepage Widget must be added to the homepage prior to configuration. Details on how to do this can be found in the Adding Widgets to a Homepage topic in the Getting Started documentation here.
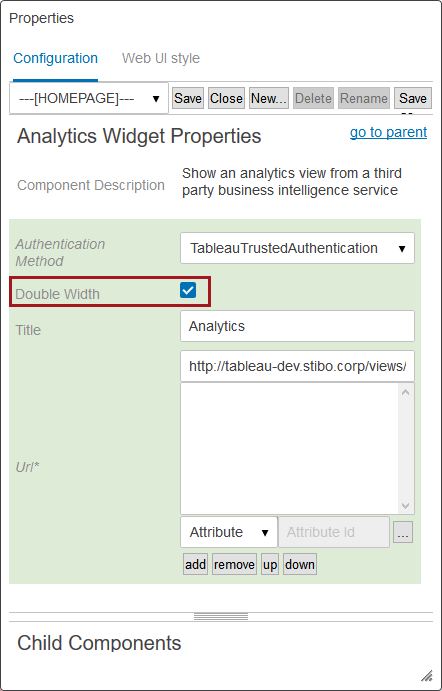
The Analytics Homepage Widget Properties window in which users configure the widget is shown below. The only parameter for the homepage widget that is different from those used to configure the analytics screen is the 'Double Width' parameter (indicated by a red box in the screenshot below). This parameter determines the width of the homepage widget. The size of the dashboard display is configured in Tableau, but it is recommended that this box is checked to create a homepage widget in the Web UI that is double-width. This allows the most information to be displayed.
Additionally, using the filtering functionality for a homepage widget would not conform to the recommended practices for this Web UI component. Optimally, the homepage widget should be neutral with respect to which objects are selected in the hierarchy.
For information on the purpose of the other parameters, see the description in the Configuring the Analytics Screen section of this topic.
Automatic authentication refers to the capability of enabling seamless access to the data analytics tool upon logging in to the Web UI. The analytics functionality available in STEP is built to accommodate many analytics tools, but with respect to automatic authentication of users, STEP supports Tableau and Qlik. Once authentication is configured correctly, the user will be granted access to the analytics server restricted by the licensing and user privileges set on the analytics environment. A suitably privileged user will have a seamless display of a Tableau or Qlik dashboard in their Web UI.
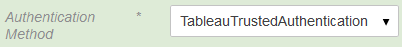
To enable automated Tableau authentication, admin users must configure Tableau to add the relevant STEP application server as a trusted host. Further, the username used in Tableau must match the username used in the Web UI to enable the authentication (the passwords, however, can be different). See the 'Trusted Authentication' documentation on the official Tableau website for details on this functionality.
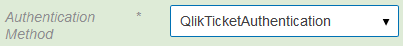
Successful configuration of automatic authentication for Qlik in the Web UI requires that a number of conditions be met:
Adding the certificate to the app server
For information on how to add the certificate to the app server, see the 'Certificate Trust' section of the 'Security Overview' documentation on Qlik's official website.
Adding the properties to the configuration file
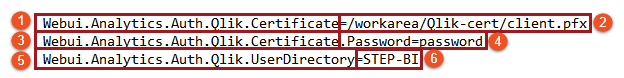
Below is an example of how the analytics properties should be written:

Below are the three sample properties divided into the components required to enable placement of the certificate.
Once the properties are properly added to the sharedconfig.properties file, the user should save the file and then execute a stop / start of the relevant STEP system. Following this (allow for a few minutes) the user with a Qlik analytics homepage widget or screen will have automated sign-in enabled, which means that access to the Qlik server will automatically occur immediately following a successful sign-in to the Web UI.
Listed below are some helpful steps users may take to facilitate proper configuration of a Web UI integration with Tableau:
To configure a Tableau dashboard to fit into a double-size homepage widget, the screen should be set to 485px wide by 260px high.
2019, Stibo Systems – Confidential