This section contains some of the most common errors experienced during system start up and how to fix them.
System Start Up
Unless a specific error is suspected, follow the troubleshooting order below. The most common problems are caused by not properly following the start up procedures.
Operating system
It is common for start up issues to be caused by problems with the operating system and hardware. Below are a few basic checks that cover most problems caused by the operating system and hardware:
- Check the system logs for any errors or warnings (/var/log/messages, dmesg).
- Check RAID (if applicable) for any errors or warnings.
- Check for free disk space on all volumes (df).
- Check the memory usage (top, prstat).
- Check for processes that may be consuming the system's resources (top, prstat).
- Check that all network connections can be established (use ping and/or browse the network).
- Check the NFS mounted filesystems by testing the file locks (flock).
Note: Before proceeding with the following troubleshooting steps, make sure all STEP components are shut down.
Using SPOT when troubleshooting STEP components
The SPOT command can be used for checking the status of one or more components.
Oracle
The listing below shows the processes that must be running for Oracle to function properly:
- Oracle Listener (tnslsnr)
- Oracle Server Processes (ora_XXXX_<ORACLE_SID>)
ps -ef | grep oracle | grep ora_
Checking log files
The main Oracle log file is called the alert log and can be found in the following directory:
<ORACLE_BASE>/diag/rdbms/<DB_UNIQUE_NAME>/<ORACLE_SID>/trace/alert_<ORACLE_SID>.log
Note: By default, <ORACLE_BASE> is /opt/oracle, but may be different in some environments depending upon company standards.
STEP
The STEP application is started by the ‘standalone’ component as mentioned in the start and stop procedures. Standalone is the name used for STEP running directly on an Oracle Java or AdoptOpenJDK VM.
When STEP has been started, a Java process is running. This can be verified by running the following command:
ps -ef | grep [j]ava
Checking STEP log files
When starting the Java process, the following log files are generated:
|
Log file |
Description |
|---|---|
|
<STEP_HOME>/diag/logs/startup-stderr.log |
Standard error output from starting the Java process is piped to this log file. |
|
<STEP_HOME>/diag/logs/startup.log |
Standard out from starting the Java process is piped to this log file. |
|
<STEP_HOME>/diag/logs/step.0.log |
Main STEP application log file. This file is rotated based on size (default 10 MB). By default, a maximum of 20 files are generated before overwriting the first file. |
|
<STEP_HOME>/diag/gc/gc.log.0.current |
Output from the Java garbage collector |
System Shutdown
STEP
If the stop command is hanging, check the STEP log file on every node of the cluster. If the log is reporting that services are still running, then this could be a background process (BGP) that is not able to stop. In this case, you will need to manually kill the Java process on the node in question. You can get the id (pid) of the Java process by running the command below:
ps -ef | grep [j]ava
The output of the Java process will contain the word 'standalone' if you are using a standalone STEP server.
Once STEP is completely stopped, you must manually verify that all STEP database sessions are gone in the database. If there are any STEP database sessions they must be removed. If you have only stopped certain nodes in the cluster, then the database sessions in question are the ones which are established from these nodes.
STEP Administration Portal
The Administration Portal (commonly referred to as the admin portal) provides a number of useful tools, enabling administrators to support and troubleshoot STEP without physical access to the system. Some functions available within the admin portal are useful only for Stibo Systems Technical Support and/or R&D groups, while others are applicable for all system administrators. Specifically, the admin portal allows administrators to:
- View and download system information, including activities and processes running on the STEP application and their impact on the servers via the Activity tab.
- View the amount and types of requests made to the system, and how long it takes for the requests to be answered via the Activity Dashboards tab.
- View and download system logs via the Logs tab
- Monitor servers, events and components via the Monitoring tab - including providing data for external monitoring systems.
- View the system properties' configurations (such as the properties and values in the system property files) via the Configuration tab.
- Trace business rules, compare system configurations, generate a system snapshot, and test user authentication via the Tools tab.
- Perform healthchecks for common system issues via the Health Check tab.
- Send diagnostics and healthcheck information to Stibo Systems via the Send Diagnostics tab.
- Extract static texts for localization or interfaces and import translations via the Localization tab.
Logging on to the Administration Portal
Prerequisites
To access the admin portal, the person attempting to log in must have a user created in STEP that is a member of a user group with privileges that include the following setup actions:
- View Administration
- View Context
Accessing the Administration Portal
The admin portal can be accessed two different ways:
- Typing the appropriate URL into any browser:
http(s)://<APPLICATION_SERVER_NAME>/adminportal
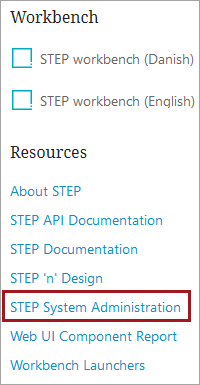
- Clicking the STEP System Administration button from the Start page:
Both methods will yield a login prompt:
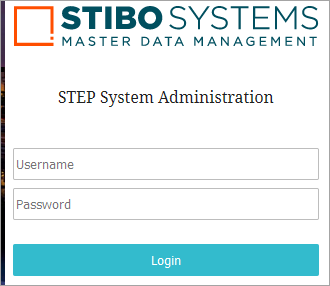
Valid credentials must be entered for login as indicated above in the Prerequisites section of this topic. Once logged in, the admin portal displays a series of tabs with various functions available on each one.
Refer to this online help page for further comprehensive documentation on the Administration Portal:
http(s)://<APPLICATION_SERVER_NAME>/help/#admin_portal/administration_portal.html%3FTocPath%3DAdministration%20Portal%7C_____0
Oracle Database Troubleshooting
As part of a STEP implementation, Stibo Systems provides a database toolbox to assist administrators in diagnosing issues that might be related to the STEP database. There are two types of toolboxes available, a toolbox that resides on the application server for tasks related to database structure, session / instance information, maintenance, and reporting; and, an additional toolbox that resides on the database server for tasks that can only be resolved when executed from the database server. Both toolboxes are installed, updated, and patched using the SPOT utility just like any other STEP component.
In summary, the database toolboxes provide the following areas of functionality to assist in troubleshooting the STEP database:
- Tablespace management — for example, viewing usage information and adding additional table space files.
- Identification and management of database sessions.
- SQL Management — for example, checking SQL execution times, performance, and plans.
- Oracle events.
For more information on using Stibo Systems' Database Toolbox, see the related STEP DB Toolboxes Guide and Examples document.