Embedded Analytics Platform Web UI Screen
The Embedded Analytics Platform (EAP) uses two components to display analytics data in the Web UI: the Embedded Analytics Platform Widget and the Embedded Analytics Platform Screen. This topic details the configuration of the Embedded Analytics Platform Screen.
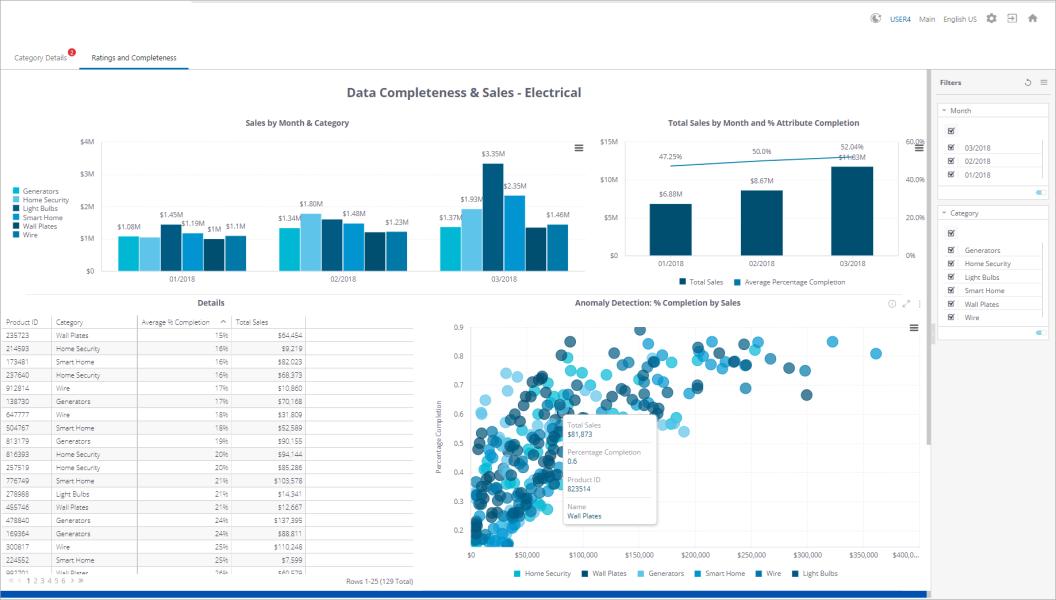
The Embedded Analytics Platform Screen is used to configure and display EAP dashboards. The following screenshot shows a sample Web UI EAP screen that displays a product category overview with an optional filter panel on the right.
Configuring the EAP Screen
The EAP screen is typically added as a tabbed page to any mapped object where the specific data analytics dashboard is most pertinent. As an example, the preceding screenshot shows a sample Web UI EAP screen that has been added as a Sub Screen Tab Page on a Node Details screen.
The EAP screen and EAP widget are configured in almost identical ways, with some minor exceptions. The configuration steps described below can be applied to configuring either the widget or the screen, except where expressly noted.
Adding the EAP Screen
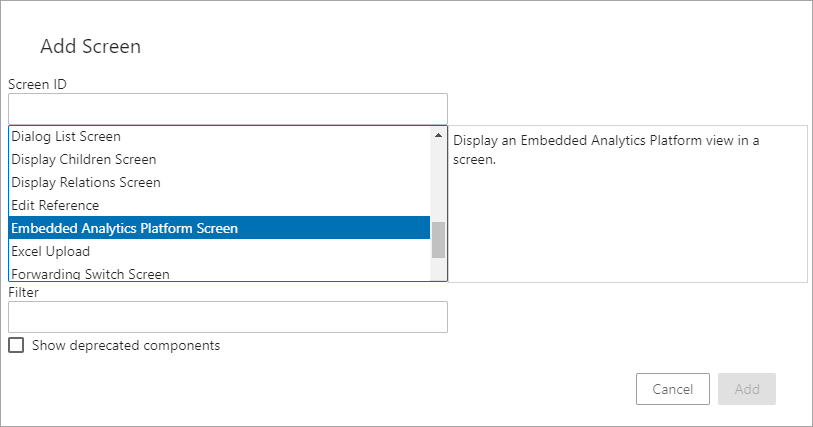
The EAP screen must be added before it can be configured as described below. The method for adding screens in the Web UI is detailed in the Creating a New Screen section of the Design Mode Basics topic
After it has been added either close the designer and configure the screen at a later time, or continue on with the Embedded Analytics Platform Screen Properties configuration.
Setting up the EAP Screen
Using the EAP screen, admin users are able to create a view from the Web UI into a published data analytics dashboard. The Properties window for the EAP Screen in the Web UI designer is shown below. The parameters that appear in the screenshot are described in detail directly beneath the screenshot.
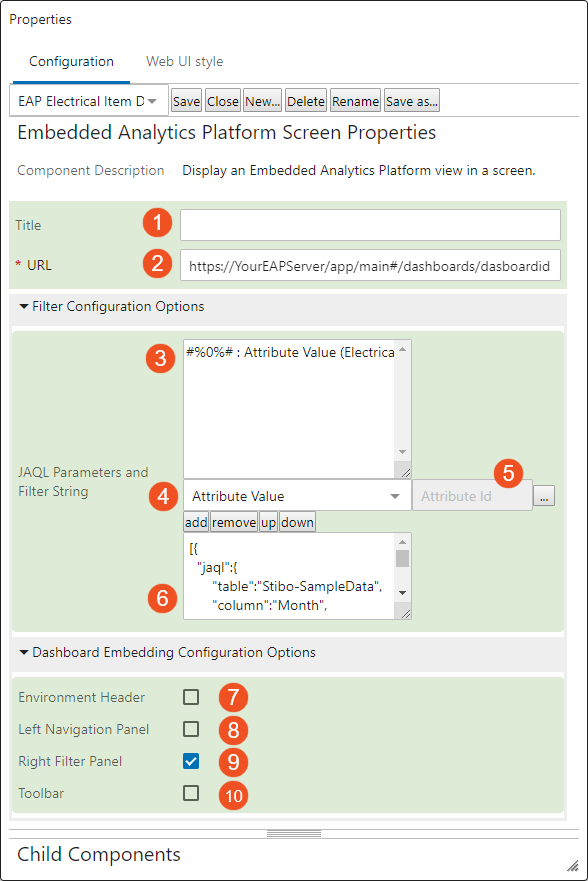
- Title: Content added to this field appears at the top of the Web UI Embedded Analytics Platform (screen or homepage widget).
- URL: Enter the relevant EAP analytics server URL; for example, https://YourEAPServer/app/main#/dashboards/dasboardid. The URL could point to a dashboard, a widget, or a view such as an admin screen. For more information and examples on how to identify / copy these URLs, see the Embedded Analytics Platform - Selecting URLs topic here.
Filter Configuration Options: JAQL Parameters and Filter String
This section contains two fields. The top field (3) is for JAQL (JSON Query Language) filter parameters. The bottom field (6) is where the JAQL filter string is entered. Use these options to configure the filters that display in the Right Filter Panel, which is addressed in more detail later in this topic.
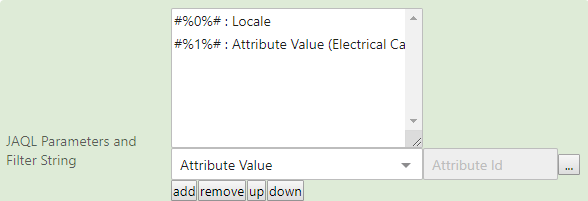
- Filter parameters (field not individually labeled) – In this field, enter the relevant filter parameters, e.g., ‘Attribute Value.’ Each selected parameter will be assigned a placeholder string that will be replaced with a context-specific value to be referenced in the JAQL query string. These placeholders also contain an embedded integer that identifies the sequence in which the parameter will appear in the JAQL filter string, e.g., #%0%# will appear first, #%1%# will appear second, etc. Moving a parameter up or down with the 'up' or 'down' button will automatically renumber the placeholder.
Note: It is recommended to generate the placeholders for the filter parameters before entering the JAQL filter string in the bottom field.
- The dropdown menu below the filter parameters field allows the selection of various options to create the filter parameters. The available parameters are as follows:
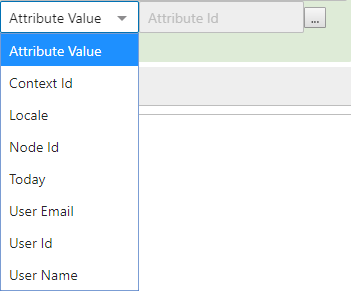
- Attribute Value: Returns, or filters the dashboard view for, a STEP attribute value
- Context Id: Returns the current context ID
- Locale: Returns the selected locale, which is used for the Web UI session
- Node Id: Returns the STEP ID of the current object (valid for EAP Screen component only)
- Today: Returns the current date
- User Email: Returns the email address of the logged-in user (if specified)
- User Id: Returns the user ID of the logged-in user
- User Name: Returns the name of the logged-in user
- The field directly to the right of the dropdown menu will display when either 'Attribute Value' or 'Today' is selected. If Attribute Value is selected, the ellipsis button displays (
 ). Clicking this button opens the 'Select Node(s)' window, where the relevant attribute is chosen. If Today is selected, a 'Date Format' window displays, in which the chosen date format is entered, e.g., yyyy-MM-dd. The date format uses the rules for SimpleDateFormat in Java.
- JAQL filter string (field not individually labeled) – In this field, enter the desired JAQL filter string. It is recommended that the string contain placeholders that correspond with the numbered dynamic values selected for the JAQL filter parameters, e.g., #%0%#. #%1%#, etc.
For more information on JAQL filter strings, see the Embedded Analytics Platform - Sample JAQL Filter topic in this guide (here). Also refer to: https://documentation.sisense.com/latest/creating-dashboards/filtering-dashboards-and-widgets/designer-filters/create-dashboard-filter.htm#gsc.tab=0
Dashboard Embedding Configuration Options
These options control which aspects of the embedded platform environment are available in dashboard screens and only apply to the EAP Screen Web UI.
- Environment Header: Adds a header to the top of the dashboard that enables you to switch to different components in the EAP platform (e.g., data admin, designer, etc.). For more information, refer to: https://documentation.sisense.com/latest/administration/embedded-analytics/embedding-sisense/embed-sisense.htm#gsc.tab=0
- Left Navigation Panel: Adds a navigation panel on the left of the screen that allows you to navigate between different embedded dashboards.
- Right Filter Panel: Adds a filter panel to the right that allows you to filter the data that is displayed on various dashboards. The filters displayed depend on where they are applied. If a dashboard is published with filters and no JAQL filter string is applied, then the published filters are applied. If a JAQL filter string is applied, then all published filters are replaced by what is defined in the filter string.
- Toolbar: Adds a toolbar across the top of the screen that provides access to additional functionality, such as a button to generate a PDF from the displayed dashboard.