Data Quality Monitoring Policies are leveraged in the Web UI where they can be viewed and actioned on by a data steward.
To use the data policies within the Web UI, there are some minor pre-configurations required. First, refer to the Data Policies topic of the Data Governance documentation for all the configuration of data policies. From the Web UI, two screens will need to be created and a navigation component will need to be added. Finally, before using this topic for configuring the data policy Web UI, users should be familiar with the process of building out the Web UI using the Web UI Designer. For more information on configuring the Web UI, refer to the Design Mode Basics topic in the Web User Interfaces documentation.
Configuring the Web UI
From the Web UI designer, create the following two screens:
- Policy List
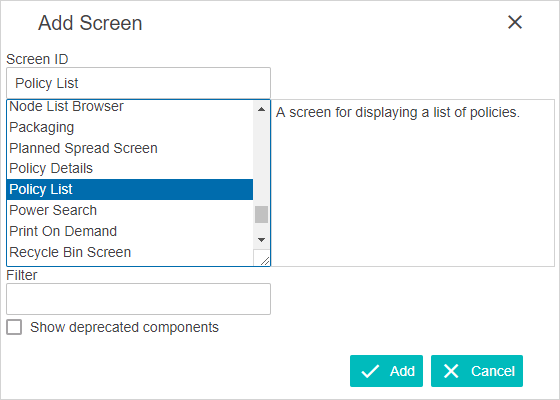
The Policy List will be the main screen where all the policies in the system are displayed.
- Policy Details
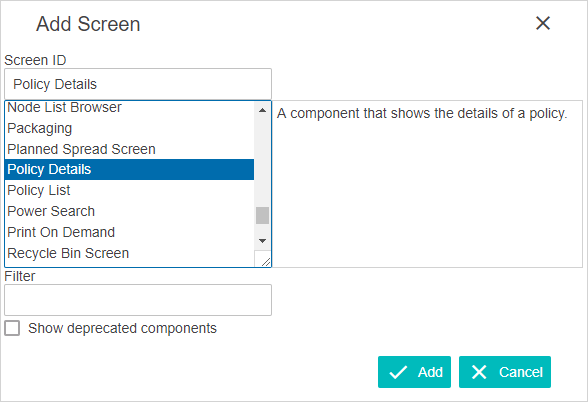
The Policy Details screen will show all the information on each policy after selecting from the policy list.
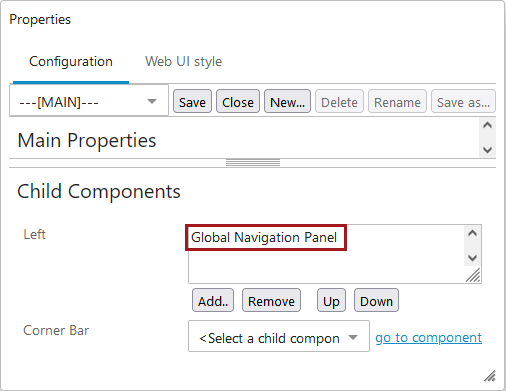
After the screens are created, from the ---[MAIN]--- screen of the Web UI configurations, under the 'Left' child components section, double click the Global Navigation Panel option.
Note: Policies only works with the Global Navigation Panel component.
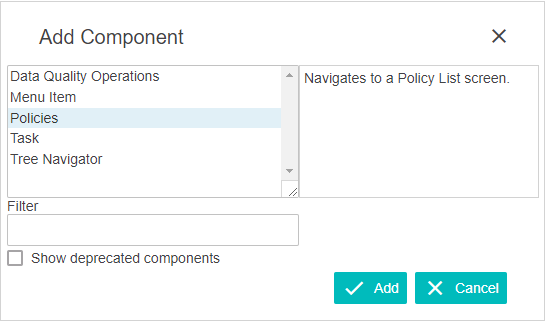
From the Menu Items section, add a Policies component.
After the Policies component has been added to the Global Navigation Panel, return to the ---[MAIN]--- configuration. From the Mappings section, select the 'Add...' option to configure screen mappings.
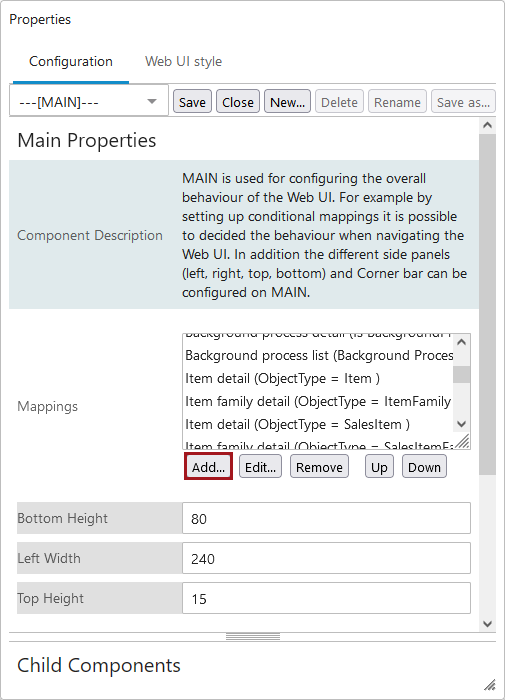
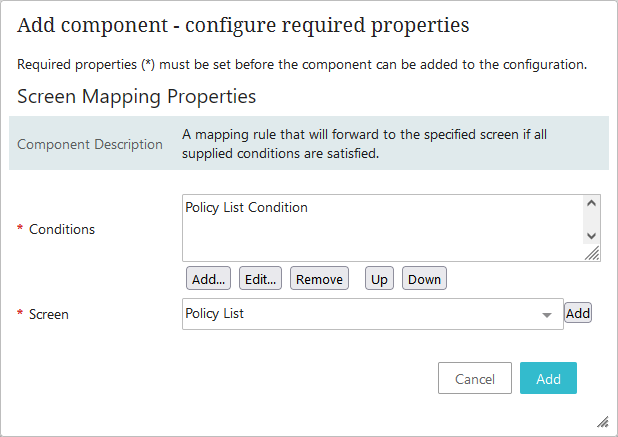
On the 'Add component' dialog, add the following two mapping conditions:
- Policy List:
- Policy Details:
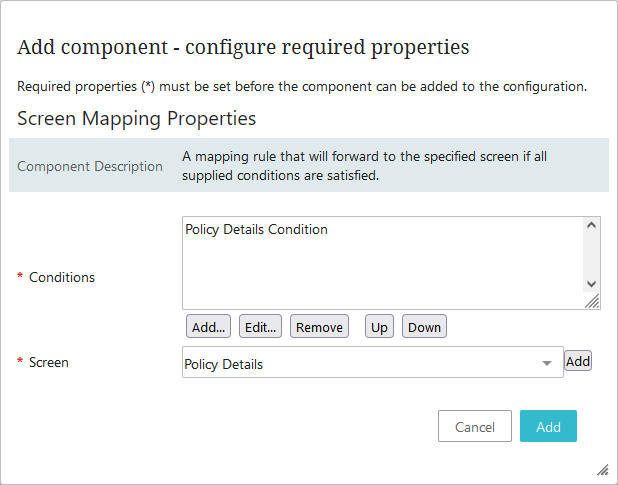
Select 'Add' then save the changes in the Web UI Designer. The Policies tab and each of the policies will now be functional.
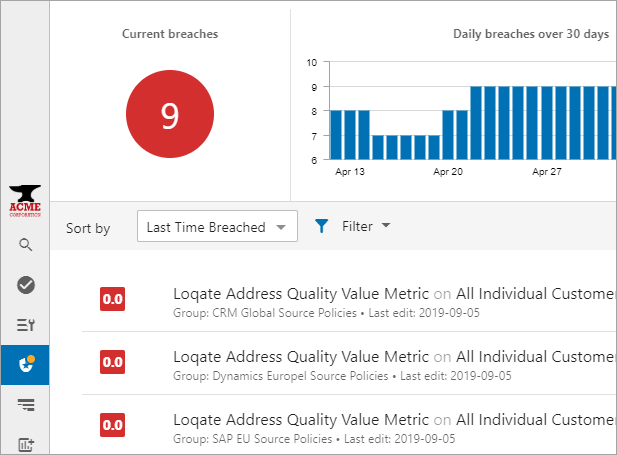
Elements of the Data Policies Web UI
Select the Policies option from the navigational panel to view a list of all available policies.
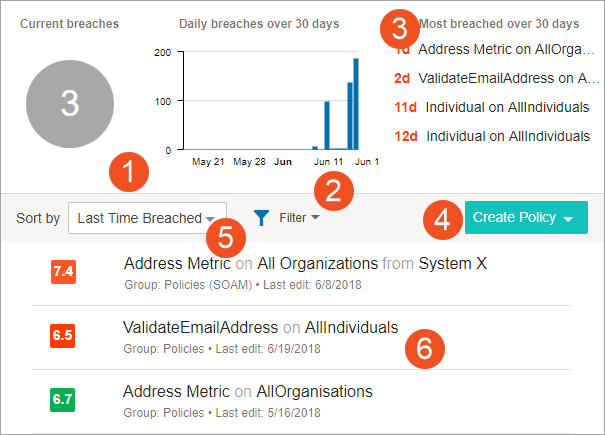
- Current Breaches - This component shows the number of policies that the user has subscribed to and are active that are currently breaching the data policy threshold.
- Daily Breaches over 30 Days - This component shows a breakdown of breaches per day over the last month.
- Most Breached in the last 30 days - This section shows which policy has had the most policy breaches in the last 30 days.
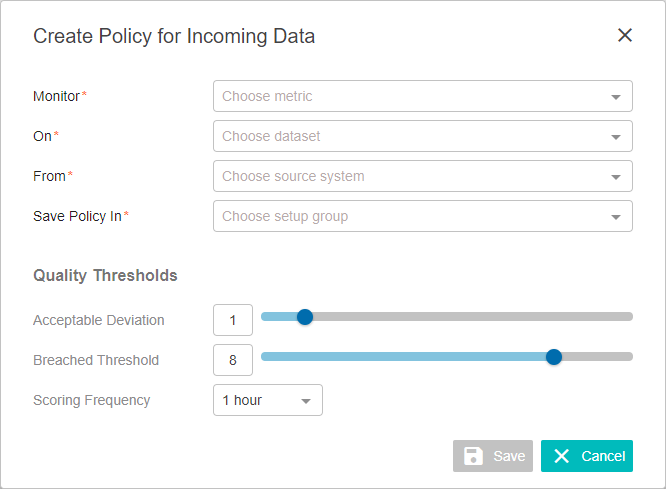
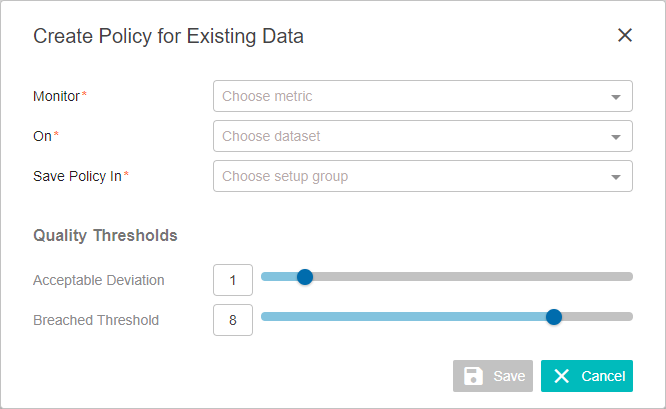
- Create policy - Click this option to create a new policy. Policies based on 'Incoming Data' is a policy for data that needs to be imported first, or a policy based on 'Existing Data' is data already on the system.
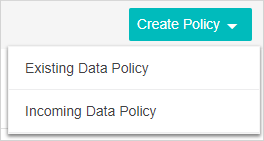
With either option, specify the data metric and data set definition and where to save the policy as well as the acceptable deviation and the breached threshold. Only with Incoming Data Policies will a source system need to be specified and the frequency at which the policy is evaluated.
This frequency determines the resolution of the score graph in the policy details screen, and the response time from bad data starts to come from a source system until the policy will be marked as breached and the user notified. A lower frequency will result in each evaluation being based on fewer incoming data. This lower frequency will cause the variation in scores may be larger.
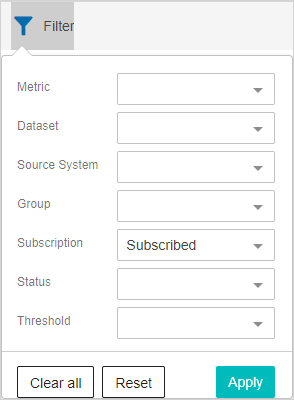
- Filter - The filter allows users to remove undesired policies based on set criteria.
- Data Policy List - This contains a list of all the data policies in your system. Selecting any will open the policy for modification.
Elements of a Policy Details Screen
When a data policy is selected from the Data Policy List, the policy can be viewed and modified via the Policy Details screen.
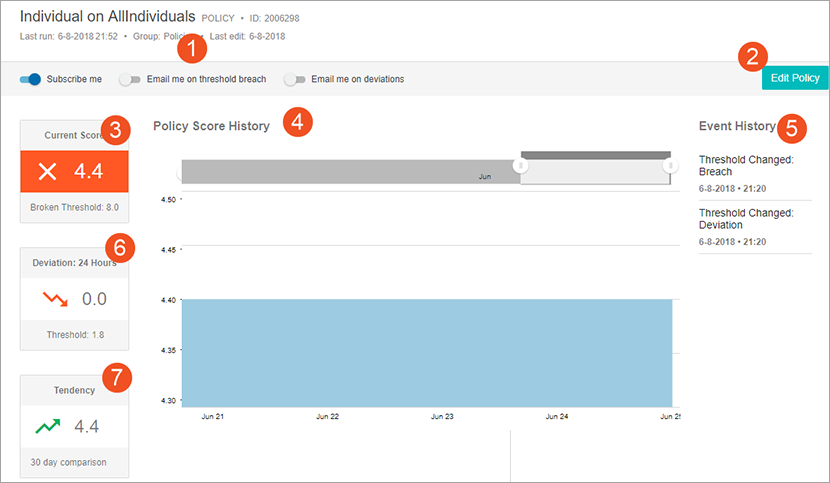
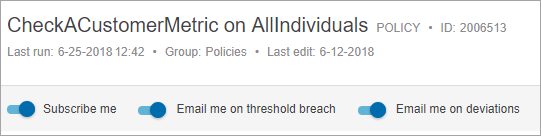
- Policy Details Card - This section includes all the information about the policy including name, ID, and creation date. Below the data policy details card, users may subscribe to the policy and/or receive email notifications when the policy has a threshold breach or deviation.
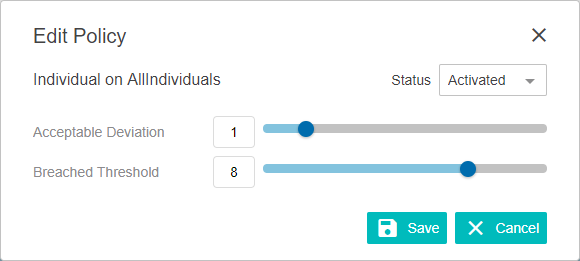
- Edit Policy Button - This button opens the edit policy dialog which allows for changes to the threshold and deviation.
- Current Score - This score is the last evaluation result of the policy.
- Policy History - This section shows historic evaluation results of the policy. This allows users to view fluctuations in the policy's score.
- Event History - This section shows all actions performed on this policy.
- Deviation: 24 Hours - This section shows the deviation, if any, of the last 24 hours.
- Tendency - This section is the comparison of the last seven days with an equivalent seven-day period from the previous month.
Web UI Homepage Widget
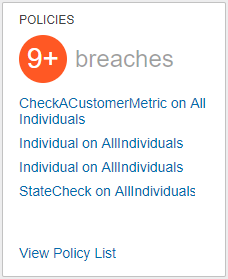
A policy widget is available for use on the Web UI home screen. This widget is used to view the various breached policies currently active in the system.
For more information, refer to the Policy Widget topic of the Web User Interfaces documentation.