The category / data profile dashboard is a highly customizable view that allows users to display profiled data using a collection of configurable widgets. Each profile can have its own set of dashboards, allowing users to group widgets together in a logical manner, and to create different views for specific user roles or tasks. Dashboard configurations are tied to the profile but are shared across all contexts and workspaces.
Pictured below is an example of a Category Profile Dashboard:
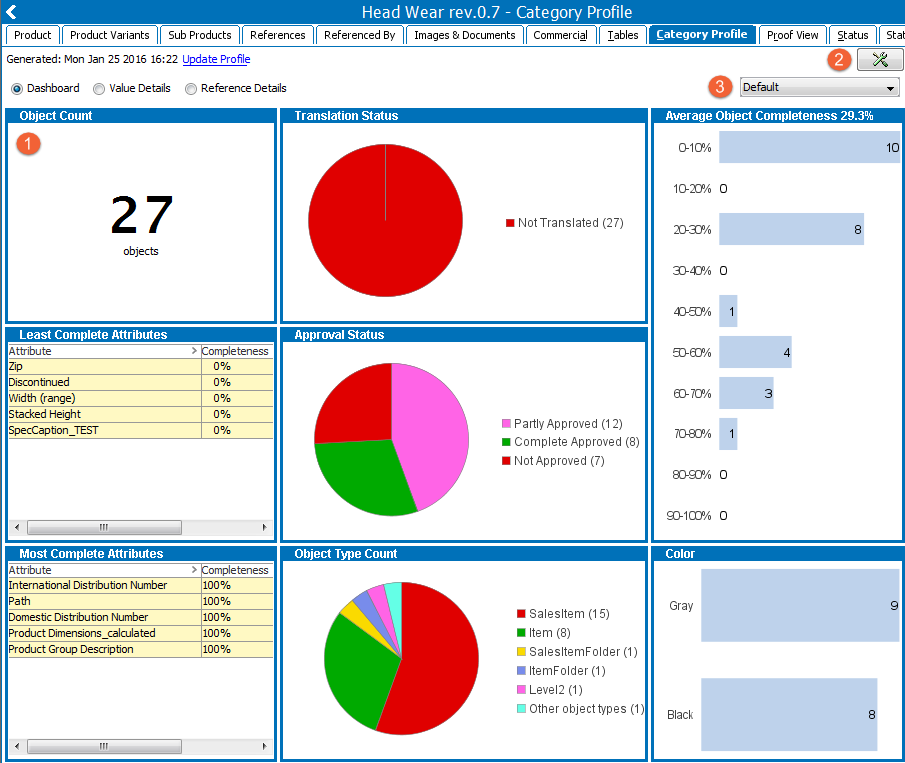
- This area displays the currently selected dashboard.
- Clicking the
 Tools button allows users to access the Dashboard Configuration and Profile Configuration views.
 - Users can toggle between dashboards using this dropdown.
Changes to a category / data profile dashboard are made via the Dashboard Configuration view, as detailed below.
Accessing the Dashboard Configuration
- In the Tree, select the relevant object hierarchy or object.
- On the Category / Data Profile tab, click the Tools icon in the upper right corner, and then select Dashboard Configuration.
Navigating the Dashboard Configuration
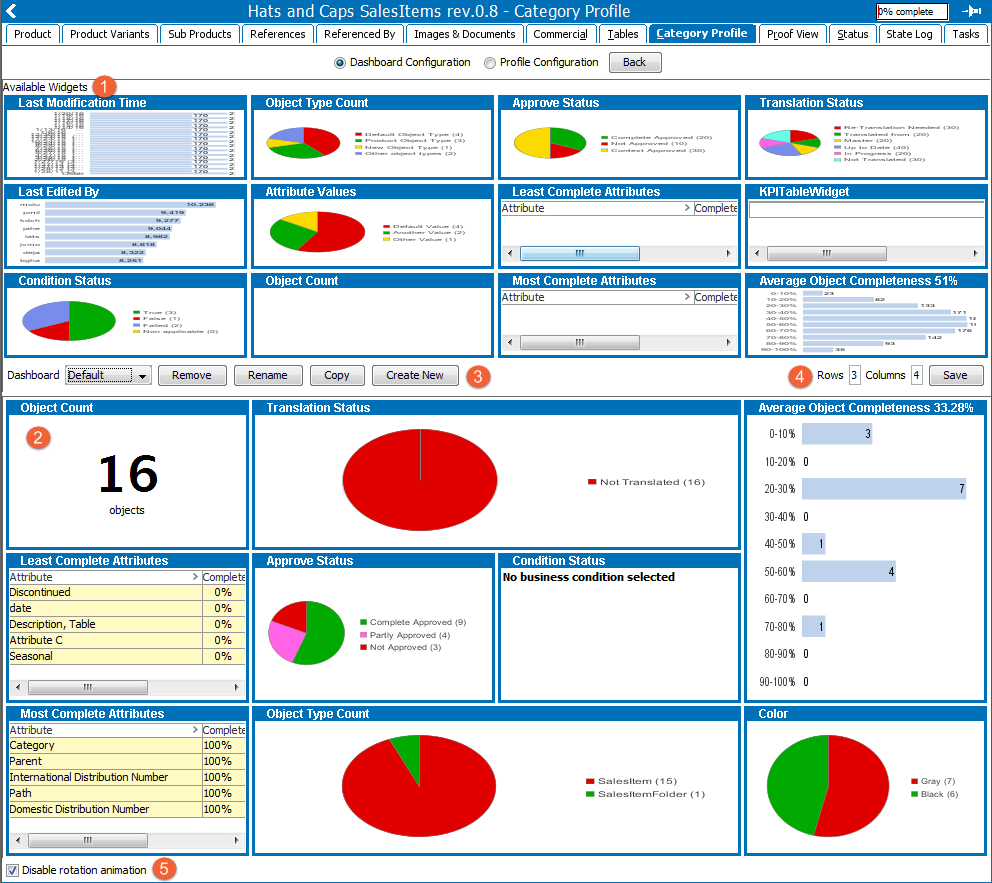
- The top area of this view contains all Available Widgets for the dashboard. These widgets can be added to the currently selected dashboard by left-clicking the title bar and dragging the widget to an empty space in the dashboard preview area (the lower half of the screen).
- The bottom area of this view contains the Dashboard Preview. Once a widget is added to this area, they can be configured by right-clicking the title bar and selecting the desired configuration option. Further details on configuring the widgets are detailed below.
Note: The data shown in the Available Widgets area is sample data. The Dashboard Preview, however, displays correct data if the category has been profiled.
- Different dashboards can be configured using the buttons found in-between the Available Widgets and Dashboard Preview areas on the left:
- The Dashboard dropdown list allows users to select whichever dashboard they want to display / edit. This dropdown selector is also available in the Category / Data Profile Dashboard view, underneath the Tools icon, and is used to toggle between dashboard displays.
- The Remove button allows users to delete the currently selected dashboard.
- The Rename button allows users to rename the currently selected dashboard.
- The Copy button allows users to copy the currently select dashboard, including all of its widget configurations. If clicked, a naming prompt will appear. Once the copied dashboard is named, it will automatically appear as an option in the Dashboard dropdown list.
- The Create New button allows users to create a new dashboard for the currently selected profile.
- In the Rows and Columns fields, found in-between the Available Widgets and the Dashboard Preview on the right-side of the view, the user can specify how many rows and columns the currently selected dashboard should have.
- Check the Disable rotation animation checkbox to disable the animation that occurs when toggling between the Category / Data Profile Dashboard and the Dashboard Configuration views.
Configuring Dashboard Widgets
Once added to the Dashboard Preview, users can configure the size and shape of their widgets, as well as filter what data appears. To access these configuration options, right-click the title bar of the desired widget and a list of options will appear.
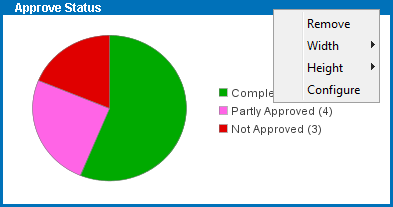
Clicking Remove will delete the widget from the currently selected dashboard. Clicking Width or Height will display a list of values - the higher the value selected the taller / wider the widget becomes. Note that increasing the size of a widget may push other widgets out of view if there is not enough space. As mentioned above, the Rows and Columns fields dictate how large the dashboard can be.
Clicking Configure displays a configuration window with additional options. These options vary between widgets, but common configuration options include: widget title, what context to display data from, what workspace to display data from, filtering data via object type, sorting order, and chart type. For more details on which options are available to each individual widget, refer to the Available Widgets section in the Data Profiling documentation
Saving the Configuration
- Once the dashboard has been configured, click Save, located next to the Rows and Columns fields, then click the Back button at the top of the screen to return to the category / data profile.
- Click Update Profile for the changes to take effect.