Monitoring Workflows
Workflows can be monitored via Workflow Profiles. Profiles are maintained on the Profile sub-tab of the STEP Workflow navigator tab. Profiles are available to users with the 'View and Maintain STEP Workflow Profile' privilege. A Profile can contain a wealth of information about workflows, such as: number of exceeded deadlines, how long the tasks have been assigned to the assignees, what is the workflow throughput this month versus the last six months, etc. This is all configured using the STEP Workflow Profile Wizard.
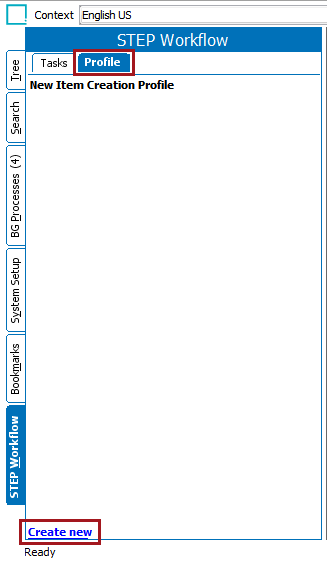
To create a new Profile, navigate to the STEP Workflow tab, select the Profile sub-tab, and click the Create new link at the bottom of the Profile sub-tab.
Step 1: Label and Type
In the wizard that appears, provide an ID, Label (name), assign a Setup Group, and choose a Domain.

The Domain options are the following:
|
Domain |
Description |
Example |
|---|---|---|
|
States |
Allows a user to view data focused on workflow states. |
|
|
Assignee |
Allows a user to view data focused on assignees. |
|
|
STEP Workflows |
Allows a user to view data focused on entire workflows. |
|
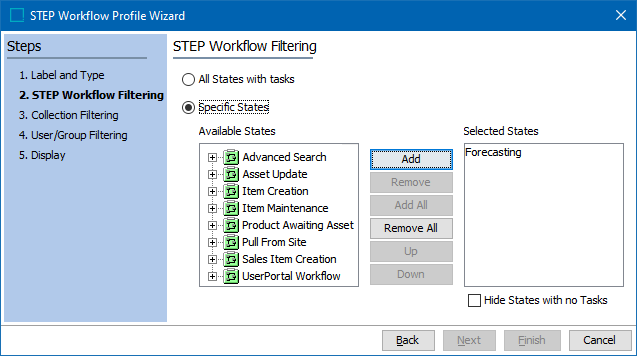
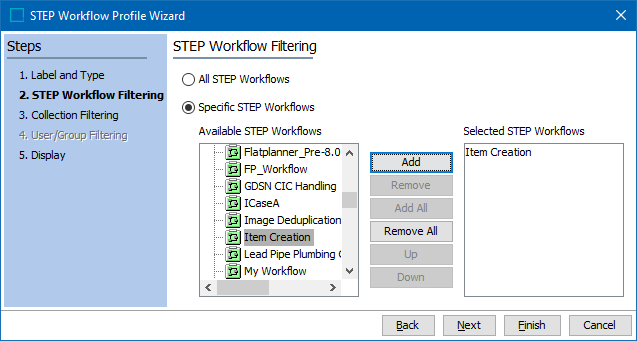
Step 2: STEP Workflow Filtering
Next, fill out the STEP Workflow Filtering screen. The workflows or workflow states (within one or multiple workflows) that the profile should contain will be specified. The options differ somewhat for each domain (selected in the previous step). Since profiles are not limited to a single workflow, a user could have an Assignee-domain Profile that shows information for tasks in numerous workflows.
According to the domain chosen, the following options are available:
- States domain: A user will specify whether the profile should contain data from all workflow states or if it should be limited to specific workflow states only. Note that if 'All States with tasks' is selected, the profile will contain data from every workflow state, from every workflow in the system. The option to 'Hide States with no Tasks' is unavailable if this option is selected.
- Assignees domain: The STEP Workflow Filtering wizard screen for the Assignees domain contains the same options as the screen that appears for the States domain.
- STEP Workflows domain: Only entire workflows can be chosen for this option. Data cannot be filtered down to the task level.
Step 3: Collection Filtering
For Collection Filtering, a user can filter the profile results to contain information only for objects in a given collection. This step is optional.
For example, a user could create a profile that only shows data for objects that are to go live at a certain date, or only shows data for objects in a particular part of the tree hierarchy.

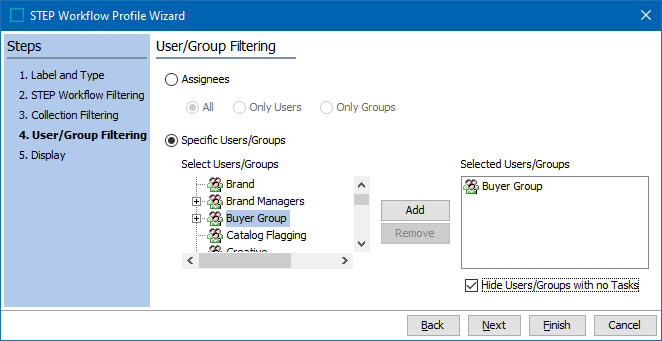
Step 4: User / Group Filtering
A user can filter the profile results to contain information only for tasks that are assigned to specific users or user groups.
Note: Step 4 is disabled for the STEP Workflows domain.
For example, in the Assignee domain, the 'Specific Users / Groups' option is valuable if a user would like to view the workload for a number of users. If the 'Assignees' option is selected, users with no tasks will also be included in the profile.
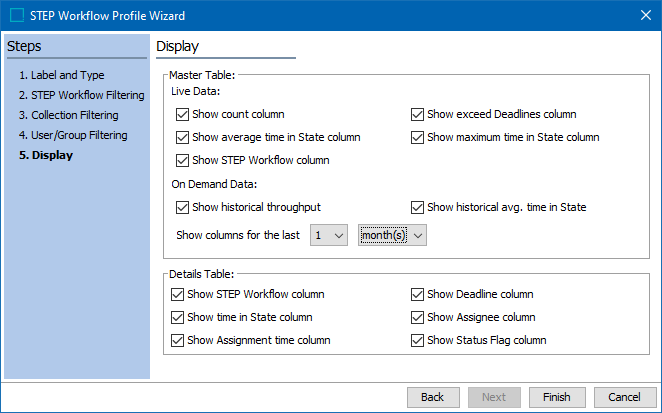
Step 5: Display
The profile display will be different depending on which domain was selected in Step 1. For the States and Assignees domains, the profile will consist of two tables: a Master Table and a Details Table.
|
Table |
Description |
|---|---|
|
Master Table |
Displays more general information about the states or assignees. |
|
Details Table |
Appears when a row in the Master Table is selected—displays more specific information about the objects that are contained within a state or assigned to an assignee. |
For the STEP Workflows domain, there is only a single Master Table. Step 5 is where a user specifies which columns should be shown in these tables.
Common to all domains are the two divisions of the Master Table settings: Live Data and On Demand Data.
|
Table Settings |
Description |
|---|---|
|
Live Data |
Data that can be kept up to date automatically—data for workflow instances in their present state. |
|
On Demand Data |
Historical data that is retrieved from the object's State Logs. |
As the name indicates, this data is only generated on demand. For all three domains, the On Demand section allows a user to specify a time period of days, weeks, or months for which they would like to generate historical data. For example, if you select three (3) days, the generated On Demand table will display three columns, one for each selected day (e.g., "Throughput today," "Throughput yesterday," "Throughput 2 days ago.")
The following sections explain the different options by domain, for Step 5:
States Domain
|
Table Settings |
Description |
|---|---|
|
Master Table- Live Data |
|
|
Master Table-On Demand Data |
|
|
Details Table |
|
Assignees Domain
|
Table Settings |
Description |
|---|---|
|
Master Table- Live Data |
|
|
Master Table-On Demand Data |
|
|
Details Table |
|
STEP Workflows Domain
|
Table Settings |
Description |
|---|---|
|
Master Table- Live Data |
|
|
Master Table-On Demand Data |
|
Profile Editor
Once a profile has been configured, it is possible to generate the On Demand data by clicking the 'Update on-demand data' button at the top of the Profile tab. It is also possible to edit the configuration and copy the master table data into the clipboard, allowing you to easily paste it into a spreadsheet (e.g., Excel).
It is important to note that the 'Update on-demand data' button option will be available only if either one or both of the check box options under On Demand Data is checked. These options are 'Show historical throughput' or 'Show historical avg. time in state' while creating a new profile. If the option is not available, it can be enabled by editing the configuration.
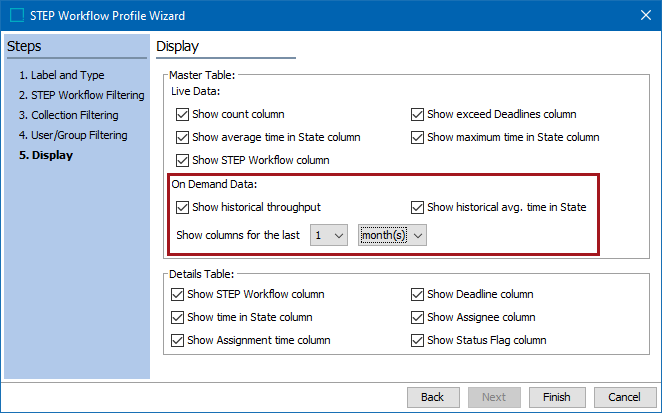
Once the 'Update on-demand data' option is run, a background process is created, and then the table is updated. The main use of this option is that it will display the number of objects that have exited the workflow (for STEP Workflow domain) within the given period or based on the average time in state.
Note: Data from Workflow Profiles can be represented in widgets on the Global STEP Dashboard. For more information, see the Global Dashboard topic in the Data Quality documentation here.