Visual Integration with Tableau or Qlik
The Web UI supports integration with the data analytics tools Tableau Server and Qlik Server. Data analytics dashboards can be displayed in either a homepage widget or in a screen. Automatic authentication for Tableau and Qlik is also supported, which allows users seamless access to dashboards in the Web UI.
A successful integration that includes automatic authentication may require configuration in the Web UI, the data analytics tool, and the application server. This guide describes only those actions that can be taken in the Web UI and the application server. Configuration actions that must be taken in the relevant data analytics tools are detailed in the appropriate vendor documentation.
This functionality supports the sharing of attribute values with the analytics environment, thus creating a dynamic dashboard that is filtered based on the selected node (e.g., product).
Configuring the Analytics Screen
The Analytics Screen is a Web UI screen that can display a much larger analytics dashboard. The screen is typically added as a tabbed page to any mapped object where the specific data analytics dashboard is most pertinent.
Both the analytics widget and the analytics screen are configured in almost identical ways. The configuration steps described below can be applied to configuring either the widget or the screen, except where expressly noted.
Adding the Analytics Screen
The analytics screen must be added before it can be configured as described below. The method for adding screens in the Web UI is detailed in the Creating a New Screen section of the Design Mode Basics topic
Setting up the Analytics Screen
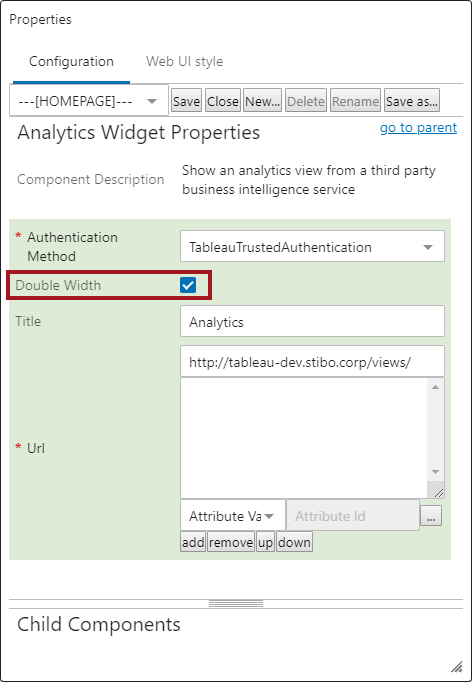
Using the analytics screen, admin users are able to create a view from the Web UI into a published data analytics dashboard. Below is a screenshot of the Properties window for the Analytics Screen in the Web UI designer. The parameters that appear in the screenshot are described in detail directly beneath the screenshot.
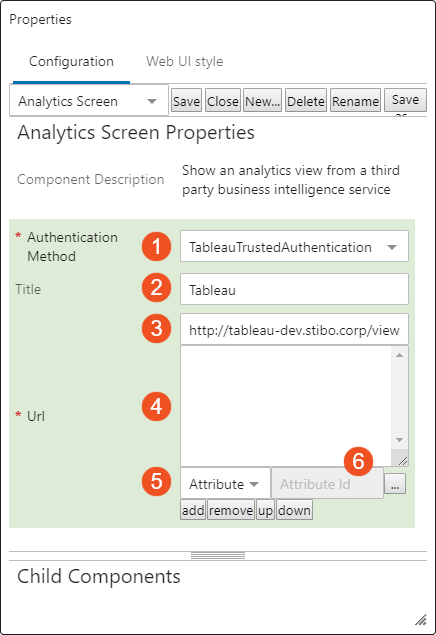
- Authentication Method: This parameter enables users to configure automatic access to Tableau or Qlik dashboards through the Web UI analytics component (screen or widget). For more information on setting up authentication in the Web UI, see the Configuring Authentication section at the end of this topic.
- Title: Content added to this field appears at the top of the Web UI analytics component (screen or widget).
- Url: This field relates to the analytics server dashboard URL that will be viewed in the Web UI. The URL can be static (showing a dashboard whose display is not dependent on which object is currently selected) or dynamic (showing a dashboard that is dependent on which object is currently selected). A static URL contains no mapping to STEP attributes. A dynamic URL does.
- The fourth field displays the attributes selected in fields five and six with their corresponding placeholder numbers (in braces).
- The fifth field is a dropdown menu from which users can select one of eight attribute types to create a dynamic dashboard in the analytics screen. The attributes selected, if matched precisely in the analytics tool, can give users a filtered view of a dashboard based on which object is selected. For instance, if a dashboard has been configured to display a pie chart representing data from ten different car manufacturers, but the user wishes only to see data for one of those manufacturers, keying on the attribute value 'manufacturer' (which must be present in both the dashboard and the Web UI analytics screen), the Web UI screen can show the same pie chart with only the data for that one manufacturer displaying. The available attribute types are as follows:
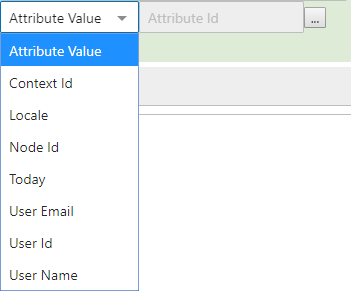
- Attribute Value returns, or filters the dashboard view for, a STEP attribute value
- ContextID returns the current context ID
- Locale returns the selected locale, which is used for the Web UI session
- NodeID returns the STEP ID of the current object
- Today returns the current date. For other date formats, this functionality uses the rules for SimpleDateFormatter in Java
- User Email returns the email address of the logged-in user (if specified)
- User Id returns the user ID of the logged-in user
- User Name returns the name of the logged-in user
- The sixth field will display when either 'Attribute Value' or 'Today' is selected in the fifth field. For instance, if the user selects 'Attribute Value,' the sixth field displays with a node picker button (
 ) beside it. Once clicked, the user may then select the appropriate attribute value in the node picker window. If a user selects 'Today', then the sixth field will display allowing users to add the date in the proper format.
After the attributes needed to implement a dynamic dashboard view have been added, but before the URL has been manually edited to include the placeholders, the URL might look something like this:
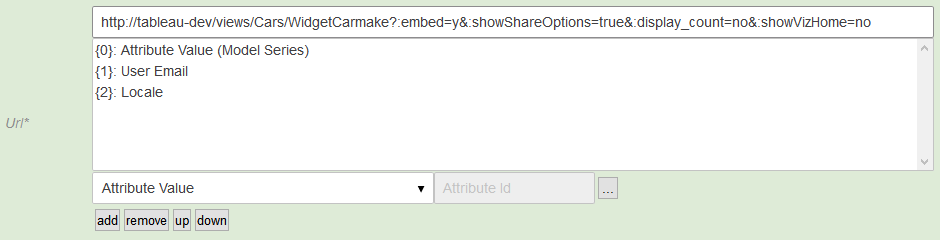
As shown in the screenshot above, the selected attributes are listed along with a braced number (ex. '{0}'). These braced numbers act as placeholders that can be manually added into the URL. Adding these braced numbers into the URL actuates a dynamic view of the dashboard.
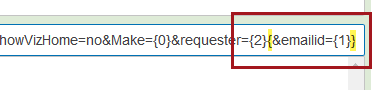
In the example below, the Tableau field 'Make' is mapped to placeholder {0}, Tableau field 'requester' is mapped to placeholder {2}, and Tableau field 'emailed' is mapped to placeholder {1}.
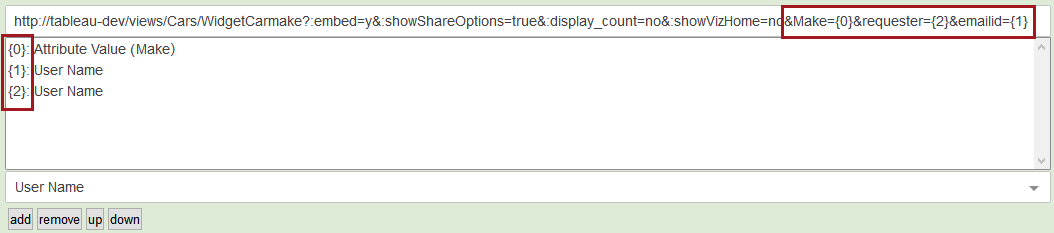
Braces can be encapsulated within braces to ensure that a URL is always valid (e.g., to avoid 404 errors), especially if one of the placeholders does not return any content. If such a placeholder within the encapsulated section does not return content, the entire section within braces will be removed from the URL parameter. An example of this is shown in the screenshot below.
For more information on how to structure the URL, users should reference the 'Using Field and Filter Values in URLs' topic in the documentation available for the relevant analytics tool.
Configuring the Analytics Widget
The Analytics Widget provides users with a quick and simple view of an analytics dashboard on the Web UI's homepage. The appearance and behavior of the analytics widget is, in large part, determined by how the dashboard is configured in the analytics tool itself. These dashboards can vary greatly based on the specific business need. Analytics widgets can be single- or double-width, and multiple homepage widgets can be configured to display multiple views of analytics dashboards.
Adding the Analytics Widget
The Analytics Widget must be added to the homepage prior to configuration. Details on how to do this can be found in the Adding Widgets to a Homepage topic in the Homepage Widgets section of the Web UI Getting Started documentation here.
Setting up the Analytics Widget
The Analytics Widget Properties window in which users configure the widget is shown below. The only parameter for the analytics widget that is different from those used to configure the analytics screen is the 'Double Width' parameter (indicated by a red box in the screenshot below). This parameter determines the width of the widget. The size of the dashboard display is configured in Tableau, but it is recommended that this box is checked to create a widget in the Web UI that is double-width. This allows the most information to be displayed.
Additionally, using the filtering functionality for a homepage widget would not conform to the recommended practices for this Web UI component. Optimally, the homepage widget should be neutral with respect to which objects are selected in the hierarchy.
For information on the purpose of the other parameters, see the description in the Configuring the Analytics Screen section of this topic.
Configuring Authentication
Automatic authentication refers to the capability of enabling seamless access to the data analytics tool upon logging in to the Web UI. The analytics functionality available in STEP is built to accommodate many analytics tools, but with respect to automatic authentication of users, STEP supports Tableau and Qlik. Once authentication is configured correctly, the user will be granted access to the analytics server restricted by the licensing and user privileges set on the analytics environment. A suitably privileged user will have a seamless display of a Tableau or Qlik dashboard in their Web UI.
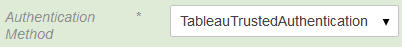
- To enable automatic sign-on for access to Tableau dashboards, users must select the 'TableauTrustedAuthentication' option from the dropdown.
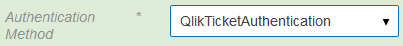
- To enable automatic sign-on for access to Qlik dashboards, users must select the 'QlikTicketAuthentication' option.
Tableau
To enable automated Tableau authentication, admin users must configure Tableau to add the relevant STEP application server as a trusted host. Further, the username used in Tableau must match the username used in the Web UI to enable the authentication (the passwords, however, can be different). See the 'Trusted Authentication' documentation on the official Tableau website for details on this functionality.
Qlik
Successful configuration of automatic authentication for Qlik in the Web UI requires that a number of conditions be met:
- Access must be established to the REST API on port 4243
- a certificate, created and configured on the Qlik server, must be placed on the user's app server
- the Web UI user name and the user name used to access Qlik must be the same (the passwords can be different)
- three new properties must be added to the sharedconfig.properties file
Adding the certificate to the app server
For information on how to add the certificate to the app server, see the 'Certificate Trust' section of the 'Security Overview' documentation on Qlik's official website.
Adding the properties to the configuration file
Below is an example of how the analytics properties should be written:

Below are the three sample properties divided into the components required to enable placement of the certificate.
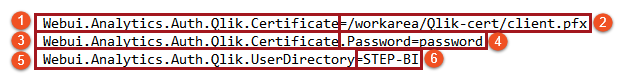
- Required text to enable the certificate location property
- The application server path to where the certificate is posted ('/workarea/Qlik-cert/'), followed by the file name of the certificate ('client.pfx')
- Required text to enable the certificate password property
- The password assigned to the certificate when it was created in Qlik
- Required text to enable the user directory property
- The name of the user directory in Qlik in which the allowable user names are contained
Once the properties are properly added to the sharedconfig.properties file, the user should save the file and then execute a stop / start of the relevant STEP system. Following this (allow for a few minutes) the user with a Qlik analytics widget or screen will have automated sign-in enabled, which means that access to the Qlik server will automatically occur immediately following a successful sign-in to the Web UI.
Useful Hints Regarding Configuration of Tableau
Listed below are some helpful steps users may take to facilitate proper configuration of a Web UI integration with Tableau:
- Enable navigation from embedded Tableau Web UI dashboards to other standard Web UI screens using Tableau 'Actions'. To do this, users must create calculated Tableau fields to generate STEP Web UI URLs using STEP IDs and screen IDs. Be sure to have STEP IDs in your underlying Tableau data to identify the target object in the generated URL. This method can be extended to access any STEP REST API functionality. For example, it is possible to initiate a workflow from within an embedded Web UI Tableau screen.
- To inform users when the dashboard was last updated, users can configure Tableau to display a timestamp. This can be done by adding the tag “Data Update Time” in the dashboard title. This is particularly useful when you have automated update processes.
- To transform STEP multi-value attributes into a Tableau list of values, use parameters and calculated fields. Users must define a Tableau parameter with the list of user-selectable values. Then, a Tableau calculated field with a Boolean condition (e.g., Tableau’s ‘CONTAINS’ function) must be defined that compares the multi-value attribute in the dashboard source data with the parameter list of values. Finally, users must add the calculated field as a filter with the option 'True' selected.
- Consider using data source filters to optimize the performance of Tableau. Data source filters exclude unnecessary data from your dashboard, which has the effect of improving dashboard performance. Standard filters only hide unnecessary data, which means the data is still processed, leading to potentially diminished dashboard performance.
- Prevent the embedded Web UI Tableau dashboard from creating new windows or tabs when following links to other screens in the Web UI by including the tag “:linktarget=_self” in the Tableau URL that is added into the STEP Web UI designer.
-
To configure a Tableau dashboard to fit into a double-size widget, the screen should be set to 485px wide by 260px high.