Activity Dashboards
The Activity Dashboards tool measures and displays the amount and types of activities that have been performed by the STEP installation, including requests made to the system and how long it takes for the requests to be answered. This tool plays a vital role in performance management.
Default Reporting
Monitored events and information captured in the default reporting tools include:
- Requests handled by the STEP application servers from different types of clients, such as the Web UI (Portal) and STEP Workbench clients
- Executions and evaluations of business actions, business conditions, and business functions
- Background process executions
- Metrics such as application server to database latency
As an example, this information can be used to determine which business rule has consumed the most CPU time on a system.
When first accessing the dashboards, an overview is provided displaying requests and response times across various types of clients, as well as requests from active users, as shown below.
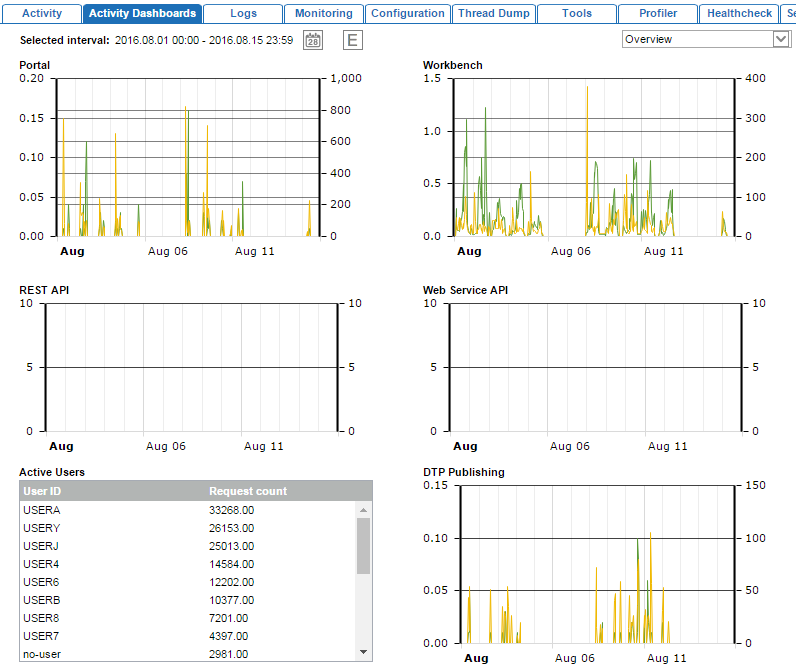
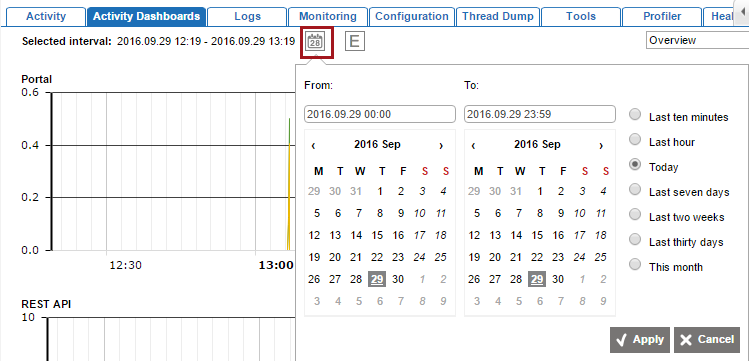
The system defaults to displaying data for the past hour, though the interval can be changed using the date picker icon.
Note: The 'no-user' that you see within the Active Users is related to the STEP Application checks that take place while the application is running. The 'no-user' activities are related to a number of things – e.g., ping requests to the Oracle database (i.e., the connection check that the application does), checks for authentication token expiry (in other words, checking if users' sessions have expired), pings to the other nodes within the cluster, and making sure that STEP caching is synchronized.
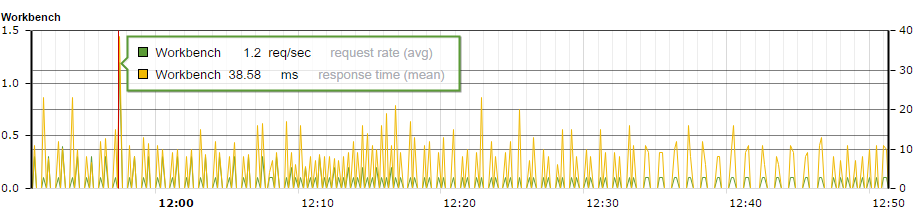
In addition, users can view more detailed information by hovering or adjusting the profile.
Hover over any displayed profile to view data for the request rate and response time at a specific point in the profile.
Adjust the profile using the dropdown in the upper right corner.
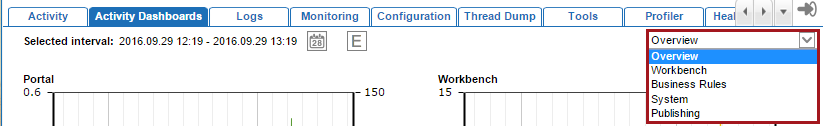
This allows users to view more detailed information within the Workbench and Publishing profiles, as well as to access System and Business Rules information that is not exposed in the default rendering. The selected interval is also applied (and can be updated) within any of the detailed profiles. A description of each profile is provided below.
- Overview: Default profile displaying the number of requests made via the Web UI (Portal), STEP Workbench, REST API, Web Service API, user actions, and DTP Publishing.
- Workbench: Provides more granular information on requests and response times in the workbench, beyond what is included in the overview. Specifically, requests and response times of the Product Editor, Classification Editor, value editing, object approvals, and drill-down searches (e.g., navigation in Tree).
- Business Rules: Provides evaluation information for business rules, broken down by individual business rules. For each business rule run during the specified interval, the following metrics are provided: average evaluation time, longest evaluation time, total time spent evaluating the rule, and number of times the rule was evaluated / executed. The rules are automatically sorted with the highest at the top (e.g., longest evaluation time shown first), enabling users to quickly identify long-running and highly used rules.
- System: Displays the latency between the application server and the Oracle database. If high latency is shown, this should be addressed with the IT department hosting the server.
- Publishing: Provides more granular information on requests and response times between the STEP application server and an InDesign / DTP server, beyond what is included in the overview. The average and maximum duration of calls made to the application server are provided per call and displayed with the longest durations first so that long-running calls can be quickly identified. Additionally, object retrieval rate and duration, object write rate and duration, and other services rates and durations are provided.
Ad-Hoc Queries
The Activity Dashboards tab includes ad-hoc querying functionality accessible via the E button at the top of the tool. However, this functionality is recommended for use only by Stibo Systems Technical Support and is therefore not described.